You’ve always been faced with the distributor challenge of how to handle supplier cost increases with your end customers.
The cost is going up, and your customer needs to be competitive. Often, the distributor is caught in the middle and trying to avoid eating a cost increase that they can’t always pass on to the customer. This “distributor squeeze” often creates the choice to lower overall margins versus sacrificing top-line sales volume. In 2021, the sheer record-breaking volume of price increases has made this process even more challenging.
This volume of price increases, along with supply chain issues that have made getting the product difficult, has created a golden opportunity to create win-wins with your suppliers and customers. This challenge has really created a great opening for you to take share, grow top-line sales and improve profits.
Proven programs and processes to use
Analyze the cost increase at the customer level to create win-win discussions with your suppliers. It all starts with a supplier scorecard process and having the processes in place to quickly analyze the impact of the cost increase.
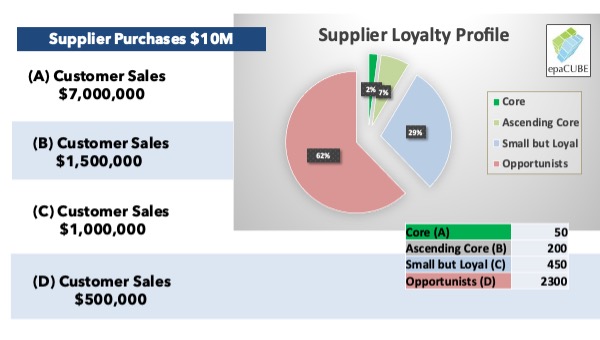
In the below example, let’s say you have a key $10-million a year supplier who sends a 5% cost increase in mid-August that will take effect in 45 days. If you have a supplier scorecard process and pair that with customer segmentation and advanced analytics at the line level, you can build programs to take share and grow profits.

Customer Segmentation. In this example above, we have outlined a simple scorecard using customer volume. You have your 50 core customers (A) who make up 70% of your sales volume, then you next largest group (B), who make up the next 15%, and so on. The reality of distribution is the larger the customer size, the more negotiating power they have with your business. The risk of just passing on the full 5% price increase and driving your business to another distributor is real for you and the supplier.
Use customer level data at the supplier level to create win-win conversations with your supplier. The below graphic is a simple overview of the cost-increase analysis at the customer level. In this example, your leadership team can see the impact of the cost increase (a full 5% increase) in sales dollars. It also quickly shows the customers overall margin versus the average margin for their customer segment.
| Customer | Overall RANK | Sales Revenue | Cost Increase Impact | Unique Items | Unique Orders | Margin $ | Overall GM% | Avg. GM% Segment |
| A53 | A | $1,209,777 | $25,299 | 820 | 1160 | $252,992 | 20.9% | -0.5% |
| A24 | A | $1,014,063 | $17,813 | 547 | 1099 | $178,130 | 17.6% | -3.8% |
| A134 | A | $913,780 | $28,514 | 31 | 5006 | $285,140 | 31.2% | 9.2% |
| A34 | A | $833,957 | $15,570 | 1029 | 1423 | $155,702 | 23.7% | 2.4% |
| A151 | A | $537,025 | $11,565 | 50 | 720 | $115,648 | 21.5% | 0.1% |
| A71 | A | $341,241 | $5,544 | 412 | 352 | $55,439 | 16.2% | -5.2% |
| A133 | A | $333,423 | $4,303 | 212 | 175 | $43,028 | 12.9% | -8.5% |
This allows your team to dive into the data and make more informed decisions. For example, customers A53 and A134 are million-dollar accounts with high potential impact from the proposed price increase. A134 is paying well above market already (are we overpriced on some key items and hurting top-line sales growth?). Customers A71 and A133 margin level are below the segment average (do we use the cost increase to move their overall margin to the average segment level?).
Immediately use the analysis to start supplier conversations on the impact of the price increase on your top mutual customers. The larger the customer, the higher the risk for both partners. Use your analysis to create win-win discussions.
For example, in the above customer analysis if you provided the impact of the price increase (and potential lost business risk) on your top seven mutual customers, it will create strong win-win partner discussions. Your supplier partner often will only have personal knowledge of your top mutual customers anyway, as they have a lot of ground to cover.
My advice is to create simple supplier reporting and ask for exceptions/conversations that create a competitive advantage.
Less is more
Limit the customer level reporting to at most your top 10 mutual accounts. The chances are good that your supplier has direct end-customer interaction with your top-10 mutual accounts. Use that to your advantage by reporting back on those top customers that they know. When they have a relationship with the distributor and the end customer, they understand the risk. The supplier will be much more likely to work with you to create Special Pricing Agreement adjustments or exceptions/decreased increases at the item level for these key customers.
Create a simple scorecard that a supplier executive can understand. The first example above that shows a simple distribution of their sales by total customers and segment is powerful. It is rare for suppliers to get a simple and easy-to-understand scorecard. You can add data points to your scorecard, but I recommend you keep it simple and use infographics and charts. Less often is more. Focus your scorecard on the key metrics that matter.
Please note: I recommend you only share with a supplier what they require, e.g., sharing overall margin, where a customer ranks for you in contribution margin, etc., are the type of items you want for your internal decision-making processes only.
Ask for cost increase delays/exceptions and sales involvement with your top accounts. If you can share the impact of the increase on top customers (passing on the full 5% increase) and risk to customer defection, you can have a great sales discussion. These are your largest customers, so get your sales leadership and supplier management teams (category management) involved quickly. If you provided your team with the top-10 affected customers and the impact, they could have discussions to take actions such as delaying the increase, passing on a partial increase, make a joint sales call with the end user, and more.
Be the data partner
In 2021, it is important to remember that your suppliers are struggling with the sheer volume of cost increases, just as you are. They are implementing one cost increase after another at such speed that it is taxing their systems (errors are increasing). Your supplier partners have fewer people and are “flying in the dark” making gut decisions, rather than data-driven decisions, at record levels. They need data to make better decisions, and the distributors who provide that data will get preferential treatment and consideration.
With strong data and a process, you can help your team have some great sales calls. If you can tell a key customer, “A 5% price increase is coming, but you are so important to us and the supplier that you are only going to a see a partial increase,” that’s a relationship building sales call for your business.
The other distributor in town who isn’t organized, who tells this same customer that they will be seeing full price increases, will likely be losing additional business to you. Your sales team can use customer-level cost increases to grow sales and customer profitability if you have the processes and analysis to support them.
Distributors with cost increase process and advanced data analytics are using the cover of cost increases to grow share with the supplier and end customer.
My first boss in distribution used to say, “Great customer-level data and analytics always leads to better decisions and sales growth.”
It’s the golden rule of distribution, and the time is now to use supplier cost increases to grow sales, share and profits with your end customers and key suppliers.
John Gunderson is VP at epaCUBE. Hear him speak on this topic during the upcoming September 9 MDM webcast, “Drive Profit in Spite of Supplier Cost Increases.” Prior to joining epaCUBE, Gunderson was a senior distribution leader for 20+ years, leading pricing, sales, category management, marketing, analytics and e-business with companies such as Crescent Electric Supply Company, HD Supply Power Solutions, White Cap Construction Supply, Anixter and EIS-INC, a Genuine Parts company, and Modern Distribution Management. Reach him at jgunderson@epacube.com.
Related Posts
-
The pipes, valves and fittings distributor saw sales improve and significantly narrowed its loss in…
-
Industrial distributor’s sales for the first six months increased 7.8% from the same period of…
-
The electrical, communications and data networking products distributor also posted a 115.9% increase in profit…


