I recently talked with a group of distributors and the conversation led to the traditional, “How’s business?” Of the group of 15 or 20 owners and senior managers, almost every one answered that business is such and such but, “We have a new (or expanding) customer, product line or market segment that has improved (or will improve) our sales significantly.” I then asked how significant that segment, product line or account’s profit contribution was going to be, and every response was incomplete; at best only at the generic, uncertain, top-of-mind level.
Frankly, those answers were no surprise. Every distributor (and every salesperson) can name their highest revenue customers and SKUs, but that’s really missing the boat. Though sales are important, it’s profit contribution that drives success.
Unfortunately, there are few individuals or organizations that know the fully loaded profit contribution of each customer and SKU, no matter how important they feel to many distributors. Knowing that contribution information is overwhelmingly the difference between dramatic successful growth and mediocrity or inconsistent results. Moreover, the process of maintaining that critical bit of information provides distributor management with exceptionally valuable strategic and operations insights.
Because every distributor has a limit to its resources, it is critically important to be able to focus on the most important current and potential relationships, products and opportunities. The challenge is not in understanding that concept but rather in finding an effective way to monitor it in a practical way.
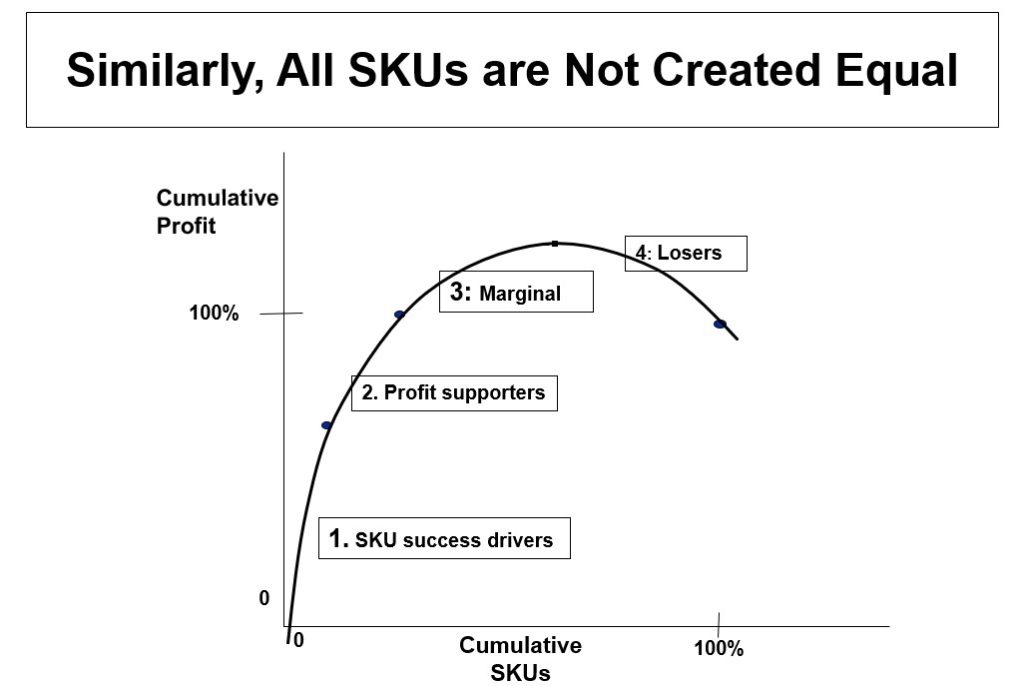
Without question, the biggest lever is to separate the noise from the potential, and to do it in a way that will best match the distributor’s priorities and resources. In order to prioritize your efforts, it is critical to start by recognizing that all customers and all SKUs are not created equal, and that the value measure of each customer and each SKU is the total bottom-line dollar profit that each one contributes (typically on an annual basis). The charts below illustrate the dramatic and often rarely recognized results of capturing profit contribution of every customer and SKU.
Virtually every example that I have measured with my distributor clients follows the overall shape of both of these charts (often affectionately nicknamed “whale charts”). The most important conclusions that are drawn from these observations are:

- Very few customers account for a highly disproportional amount of almost every distributor’s profit (Chart 1).
- As a result, gaining or losing one of these customers can dramatically change the financial results of your organization.
- Moreover, responsive service, focusing SKU availability, and special targeted capabilities (although complex and perhaps expensive) is absolutely warranted to maintain and expand those do-or-die relationships.
- No matter what, you are going to lose money on some customers and make much less than you’d like on others. If you know where (and how) that happens, as well as where there is (or is not) potential, it sure helps a lot in planning.

- Very few SKUs account for a highly disproportional amount of almost every company’s profit (Chart 2).
- Nonetheless, for those customers who are in that key category, even the breakeven or loss SKUs must be serviced and provided at a high priority level.
- For SKUs in general, service levels should appropriately vary in accordance with the profitability contribution of the SKU and the customer relationship.
- No matter what, you are going to lose money on some SKUs and make much less than you’d like on others. If you know where (and how) that happens, it sure helps a lot in planning and execution.
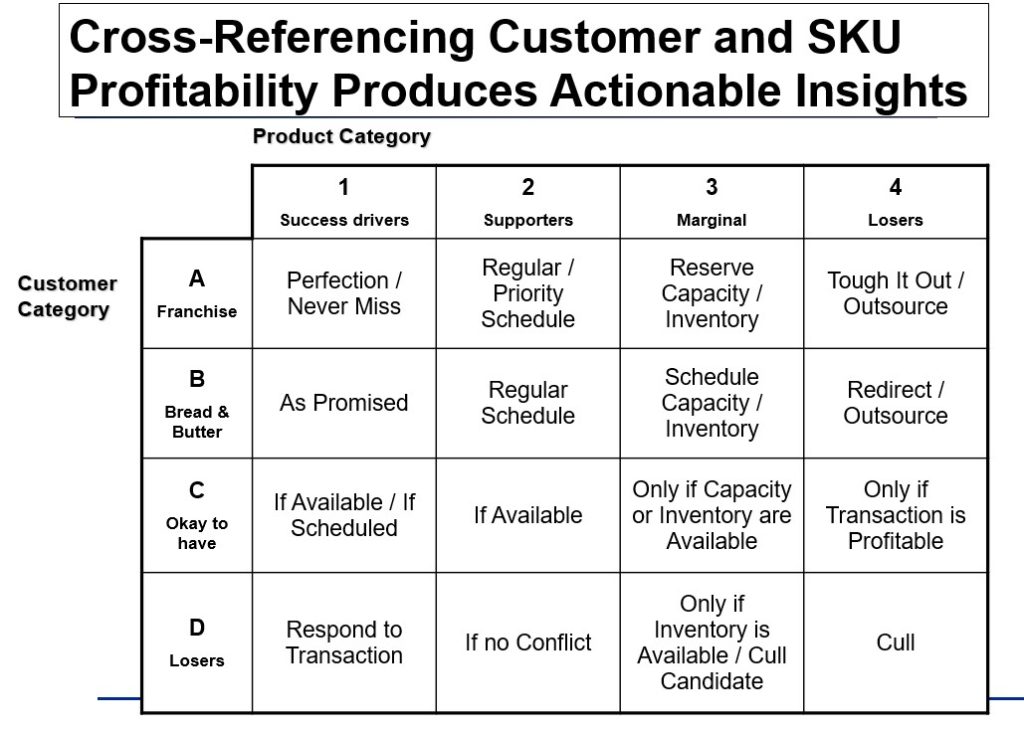
Taken together, it is extremely beneficial to plan and orchestrate investments in both customer relationships and SKU availability, according to their current (and in selected cases, their potential) total profit contribution. The chart below highlights the appropriate focus of every customer and SKU category, and emphasizes the following realities:
- For most distributors, the four boxes at the top left corner account for 100% of profit, yet without servicing the other boxes, growth is rarely possible.
- Understanding where every customer and SKU stands provides clear insight into where limited resources can generate the best leverage and success.
- Moving one customer from B to A is likely to achieve your target results for the year.
- Broadly culling loss-generating or low contribution SKUs rarely is a successful strategy, but helping with substitutions and alternatives can often satisfy the needs of profitable customers.
- Selective, focused strategies that are consistently executed (regarding limited targeted customers or SKUs) have high probabilities of economic success.
- The more distributor teams review the practical information that is collected with this model, the better its results.

To monitor these measures, a distributor generally must add an activity-based costing module to the software they are already using. Installing and using that methodology is quite easy to do, and it requires minimal daily operating time commitments.
Regardless of the efforts, however, the results have been consistently dramatic. Specifically, I have witnessed exceptional results among distributors that have followed this process in the following industries: HVAC, specialty steel, building products, custom insulation, highway trailers, automotive specialty parts, used cars, dairy specialties, fresh packaged vegetables, restaurant supplies, promotional toys, banking, and others.
As a critical added value, the nature of the approach consistently brings together operations and marketing people who immediately share benefits (both in results and economics) and redirect their efforts toward long term success.
Questions, comments, or corrections? Reach Robert Sabath of Transportation and Logistics Advisors at (847) 983-8934 or rsabath@tandla.net.
Related Posts
-
The company reported an operating loss of $115.8 million.
-
Industrial & Flow Technologies sales were down 3% compared to sales for the same period…
-
For the first six months sales decreased 5% to $8.3 billion.


